

Contents
What is the indifference curve?
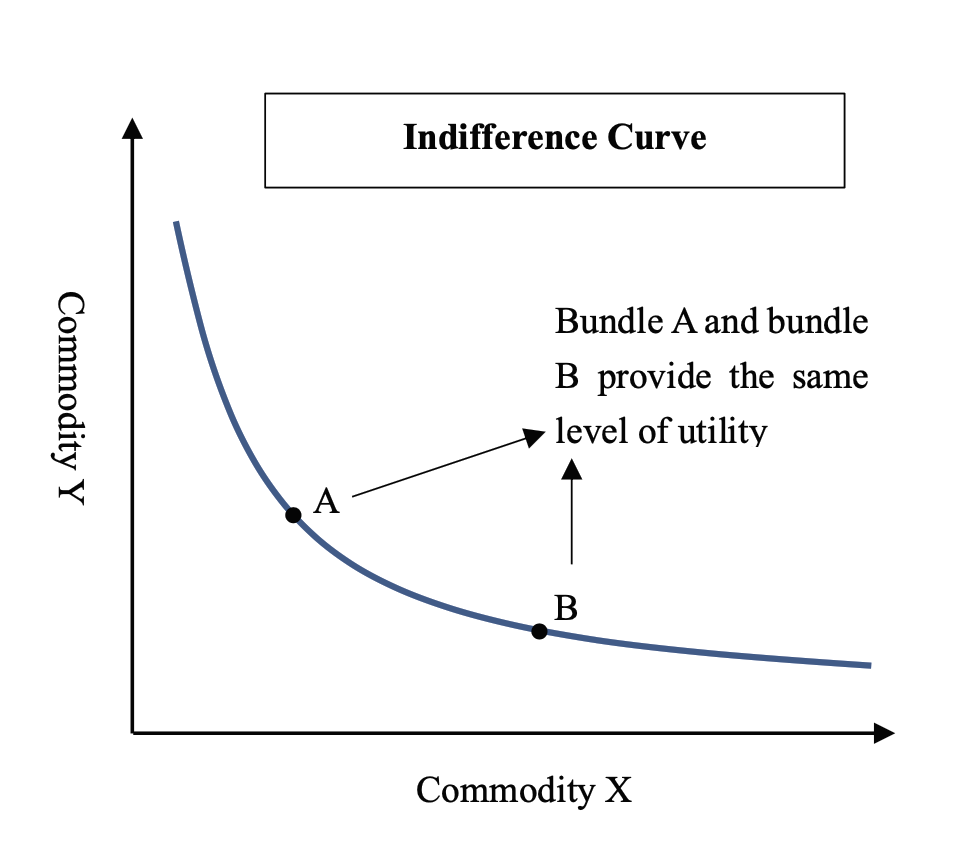
An indifference curve is a graphical representation of consumer satisfaction with two goods or commodities in various combinations. The satisfaction of two goods combinations is equal at all points(bundles) of the curve, so it is called the indifference curve. These combinations show through a table called the indifference schedule.
For instance, we take two goods (apple and banana) with different combinations which showed in the indifference schedule table below, which give the same satisfaction level ‘a’.
| Combinations | Good X (apple) unit | Good Y (banana) unit | Satisfaction |
| A | 1 | 30 | A |
| B | 2 | 25 | A |
| C | 3 | 21 | A |
| D | 4 | 18 | A |
| E | 5 | 16 | A |
The above-discussed table is showed the same level of satisfaction with various combinations of goods. We can understand from this table is that a person eats 1 apple and 30 bananas he gets the same satisfaction as he eats 4 apples and 18 bananas or other combinations. In this, one good gets increased and another decreased till the Marginal Rate of Satisfaction becomes equal.
The above depicts how a person is ready to sacrifice 5 bananas to get 1 additional apple to achieve same level of satisfaction that he was getting while consuming 1 apple and 30 bananas.
The slope of the indifference curve- The indifference curve has a downward and convex to the origin slope. The indifference curve is a rectangular hyperbola in shape. It is the alternative to marginal utility analysis.
The slope of Indifference Curve ( Meaning Rate of Substitution)= ∆y/ ∆x
Analysis of Indifference Curve
The slope of commodity Y ie. Banana is falling at higher rate because a person having 30 bananas and 1 apple is ready to sacrifice 5 bananas for 1 apple because he has scarcity of apple. But, the slope becomes flat after sometime because for a person if he has left with 18 bananas and 4 apples then he is ready to sacrifice only 2 bananas for 1 apple because now he has scarcity of bananas.
It is human tendency to demand more of the product which is scarce.
Properties / Features of indifference curve:
- The slope of IC is a downward (negative)slope that means the quantity of two goods is inversely proportional to each other.
- IC is convex to the origin.
- Two IC never intersect with each other in the indifference map (a group representation of IC) because intersecting point shows equal satisfaction of two IC which is not possible.
- In the indifference map, the higher IC represents (higher IC means the right curve) the higher satisfaction level.
Let’s get familiar with the importance of the Indifference Curve (IC)-
- In consumption- IC tells the level of satisfaction from consuming two goods different combination.
- In the production field- IC is known as iso-product curves which represent the combinations of two factors of production for the same amount of output. The producer’s equilibrium point is that point where an iso product curve will be tangent to an iso-cost curve.
- With the help of the indifference curve we can measure the consumer surplus which is the difference between the amount of money that a consumer is willing to pay for goods and how much he actually pays.
- In economic welfare- IC measures economic welfare like how much individual sacrifices and gets benefits for taxes.
- With the help of the indifference curve one can measure the impact on the living standard due to price changes. If the change in a price raises the indifference curve before means the change gets to raise their standard of living. But if IC gets lower than before due to a change in price means change adversely affects their standard of living.
- In the framing of tax policies by the government IC is useful because through it government can analyze the sacrifices and benefit levels people will get from policy.
- In exchanges the goods- IC tells how should two individuals exchange the goods according to their mutual needs to get maximum satisfaction. The exchange will happen until both individuals don’t get the same MRS.
- In ration distribution of food in public. Ration quantity of different commodity can be increased and decreased by the two different individuals mutually to get maximum satisfaction because satisfaction level from different commodity is different for each individual.
- In the distribution field- IC explains why the supply curve turns backward after a point because, after a particular wage, the positive income effect increases the negative substitution effect.
Thanks for reading this article. Hope you found it very insightful and eye opener.
For more such blogs, visit Bharatpaisa.com
Please comment your questions and feedback below.